Recording the Site: Topography-Database-GIS
Recording is everything in archaeology. If you don’t record something, the evidence is lost,
The overall aim of the topographical survey of the Kephali is the investigation and mapping of visible archaeological, architectural and topographical features, an ongoing process. All the retrieved archaeological data are recorded on the field in a database on a series of Panasonic Toughbook CF-19 computers, linked to our general database which is also used by the Apothiki (Fig. 1). All this information is processed in a Geographical Information System (GIS) environment which is the link between the topographical survey and the database.

Fig. 1. Operating the Panasonic Toughbook CF-19 on-site database © Sissi Project.
The main work of the topographical team consist in measuring the various actions taking place in the trenches: units excavated, artefacts found, samples taken, etc. and this each time with all relevant coordinates. This also includes installing reference points to georeference aerial pictures (drone, kite, pole), staking out trenches and shooting points as a support of the architectural team.
Since 2010, Nicolas Kress is responsible for the topography, helped in the field by a succession of students (Fig. 2). With the introduction of a drone in the field work, more and more attention goes to the georeferencing of aerial pictures in addition to the continuous measuring of the archaeological record in the trenches. In the past we have used a Leica TCRA 703, provided by the IMS in Rethymnon and a Trimble VX provided by Couderé (now Allterra).
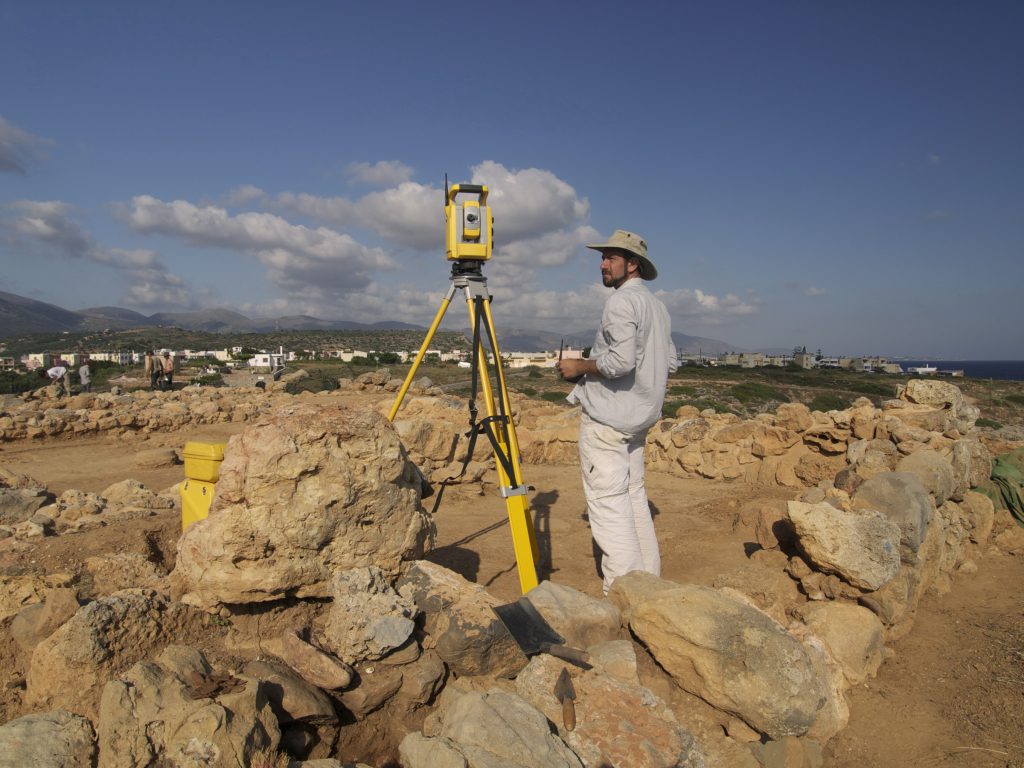
Fig. 2. The Trimble VX in use by the topographical team © Sissi Project.
Our Access database, created in 2007 by Hubert Fiasse and Fabien Pêcheur, is built around the archaeological unit which we call “ZEMBIL”, the traditional rubber basket used for collecting sherds. All other data are linked to this (date, trench, registrar, soil,…). This page allow us to record “Object”, “Features”, “Samples”. Within each of the pages there are specific fields such as: date, trench, type, preservation state, colour, linked to,… The “Zembil” and “Objects” pages have additional fields that can be used in the Apothiki. This allows the post-excavation team to add extra information such as the weight of the sherds, their preliminary date, conservation information, sherd size, number of sherds, fabrics,… The apothiki team uses two Panasonic Toughpad FZ-G1.
Integrating topographical, archaeological, and architectural data in a GIS environment presents the next step. This integrated information can then be used to generate a variety of maps For a contour line of the site, for example, we use the topographical survey data, with a 3D model of the hill produced by the drone, which we transform in a DEM. From this DEM we can produce a map showing contour lines, but also slope in %, viewshed, point of visibility, sun…


Fig. 3. An example of Integrated data: Elevation and Slope maps of the Sissi hill © Sissi Project
Apart from the usual recording, we also keep a video diary. Twice a day, our cameraman passes each area of the excavation to record visually (with spoken comments by the area supervisor) what has been going on (Fig. 4). When something happens – a strange feature, an interesting observation, a special find – this is also recorded. This represents a lively record of what has been going on at Sissi over the last 10 years.

Fig. 4. Video notebook in action © Sissi Project.
Nicolas Kress